

Progress Summary
Progress Summary
The progress summary is the first thing you see on the trends page. It provides a quick, at-a-glance comparison between your latest analysis run and the previous meaningful run, highlighting whether your AI visibility is improving, declining, or holding steady.
Run comparison logic
The progress summary does not simply compare the two most recent runs. Instead, it compares the latest completed run with the previous meaningful run -- a run that has enough valid responses to produce statistically relevant metrics. This ensures that a failed or incomplete run does not skew your comparison.
If only one completed run exists, the progress summary displays current metrics without deltas, since there is no baseline for comparison.
Headline metrics
Two core metrics are shown prominently in the summary card:
Entity mention rate
The percentage of AI responses that mention your company by name. This metric tells you how well AI systems know about your brand and consider it relevant to the prompts in your project.
Each metric displays:
- Current value -- the rate from your latest run.
- Previous value -- the rate from the comparison run.
- Delta -- the absolute change between the two values (e.g., +0.05 means a 5 percentage point increase).
- Delta percent -- the relative change expressed as a percentage of the previous value.
- Direction -- a visual indicator showing whether you improved, declined, or remained unchanged.
Website citation rate
The percentage of AI responses that include a link or reference to your website. This metric goes beyond brand mentions -- it measures whether AI systems consider your website authoritative enough to cite as a source.
The same five data points (current, previous, delta, deltaPercent, direction) are shown for website citation rate.
Direction classification
The direction indicator follows a threshold-based classification:
- Improved -- the delta is greater than +0.01 (more than 1 percentage point increase). Shown with a green upward indicator.
- Declined -- the delta is less than -0.01 (more than 1 percentage point decrease). Shown with a red downward indicator.
- Unchanged -- the delta falls within the range of -0.01 to +0.01. Shown with a neutral gray indicator.
The 1 percentage point threshold exists to avoid flagging noise as meaningful change. Small fluctuations in AI responses are normal and do not indicate a real trend.
Why the threshold matters
AI responses are non-deterministic. Even without any changes to your website or content, the same prompt can produce slightly different results across runs. The 0.01 threshold filters out this natural variance so that only genuine shifts are highlighted.
Period label
The summary card includes a period label that tells you the time range of the comparison. The format adapts based on the gap between the two runs:
- Cross-month comparison: "January 2026 to March 2026" -- when the runs span different months.
- Same-month comparison: "5 March to 22 March 2026" -- when both runs fall within the same month.
This helps you understand the time window over which changes occurred, which is important for interpreting the magnitude of change.
Prompt movements overview
Below the headline metrics, the summary includes a concise breakdown of prompt-level changes:
- Gained -- the number of prompts where your company is now mentioned but was not in the previous run.
- Lost -- the number of prompts where your company was mentioned previously but is no longer.
- Stable visible -- prompts where you were mentioned in both runs.
- Stable invisible -- prompts where you were not mentioned in either run.
These four numbers always add up to the total number of prompts in your project. They give you an immediate sense of whether your visibility is broadening or narrowing.
Top gains and losses
The summary highlights up to 5 prompts that gained visibility and up to 5 prompts that lost visibility. Each entry shows:
- The prompt reference (e.g., "P-12").
- The prompt label or text snippet.
This lets you quickly identify which specific queries are driving your overall improvement or decline, without needing to scroll down to the full prompt movements section.
Sample size transparency
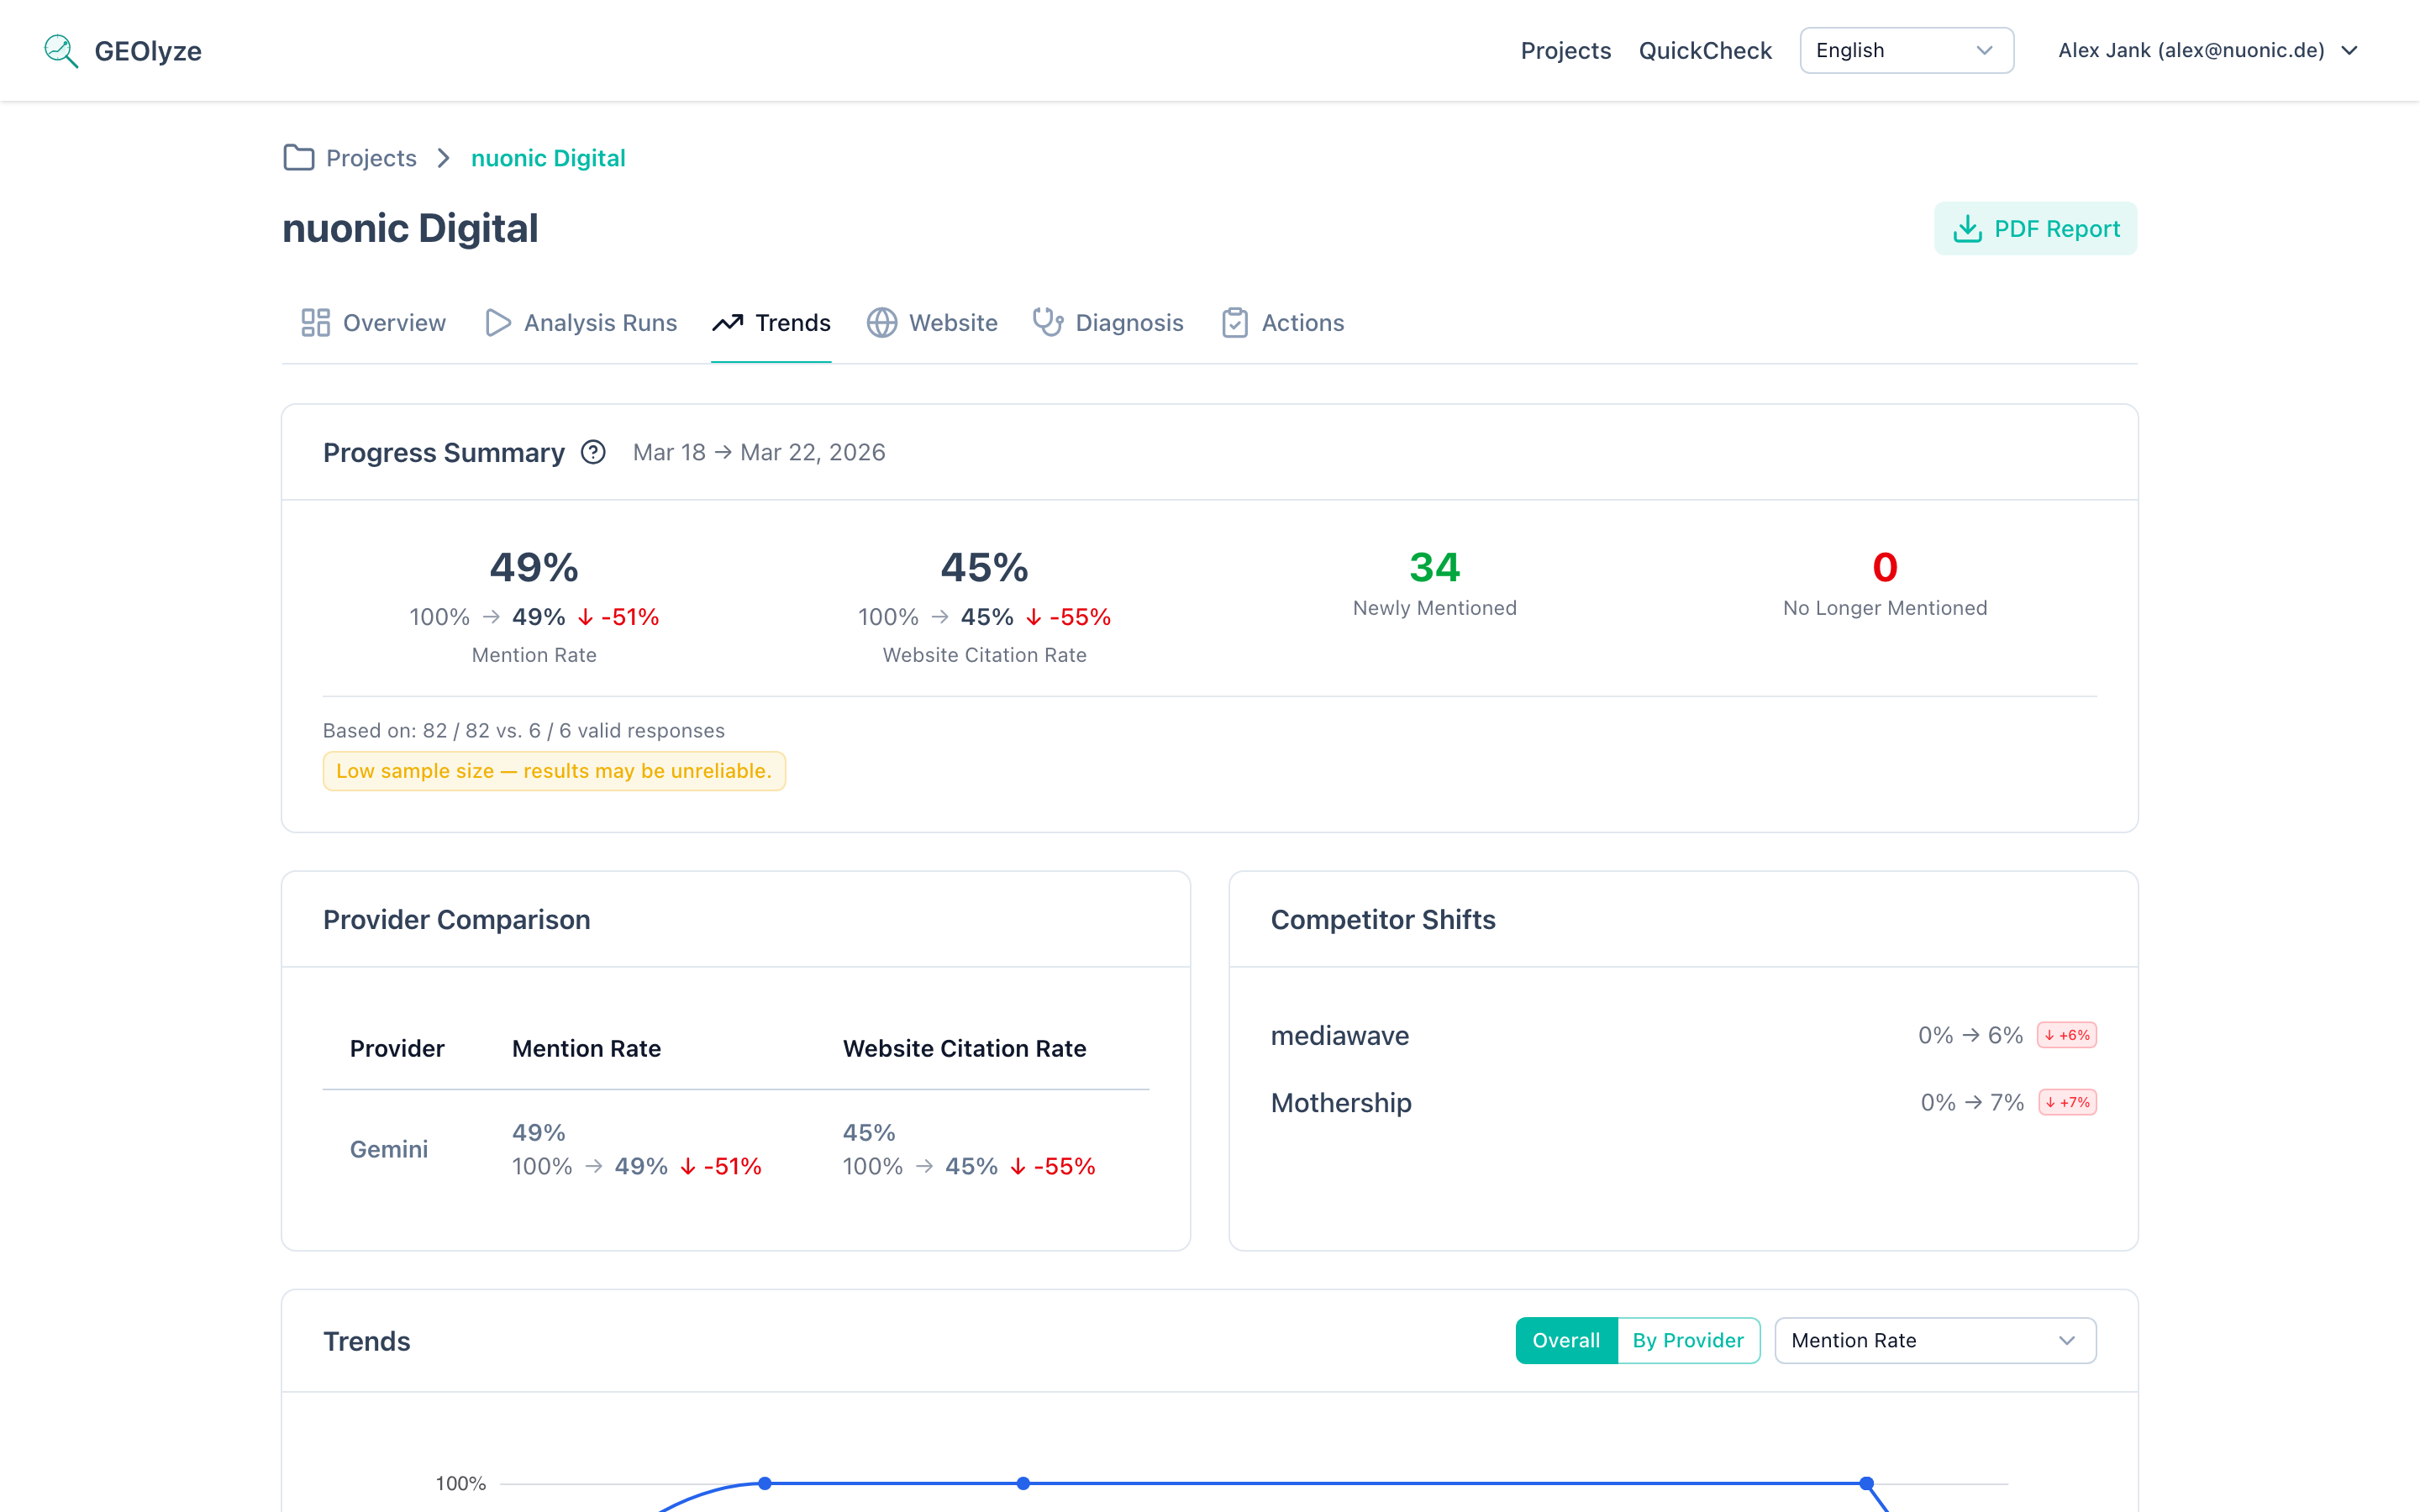
Below the summary card, the system displays the number of valid responses out of total responses for both the latest run and the base (comparison) run. This transparency is critical because:
Low sample warnings
If either run has a low number of valid responses (typically below 10), a warning badge appears. Low sample sizes mean that individual responses have an outsized impact on the overall rate, making the metrics less reliable.
Sample mismatch warnings
If there is a significant difference in sample sizes between the two runs (e.g., 50 valid responses in the base run but only 15 in the latest run), a mismatch warning is displayed. This can happen when:
- Some providers experienced outages during a run.
- The prompt set was modified between runs.
- Rate limits or errors caused some responses to be discarded.
When a sample mismatch warning is present, interpret the delta values with caution. A change in metrics might reflect the different sample composition rather than a genuine shift in AI behavior.
What counts as a valid response
A response is considered valid when the AI provider returned a complete answer that could be analyzed for entity mentions and website citations. Responses that timed out, returned errors, or were empty are excluded from the valid count.
Using progress data for GEO optimization
The progress summary is your primary feedback loop for Generative Engine Optimization (GEO). Here is how to use it effectively:
Establishing a baseline
Before making any optimization changes, complete at least two runs to establish a baseline. The first comparison gives you a starting point from which to measure improvements.
Recommended analysis cadence
- Weekly runs are ideal for active optimization periods when you are making content changes, updating schema markup, or adjusting your SEO strategy. Weekly data points give you enough resolution to see the impact of individual changes.
- Bi-weekly or monthly runs are appropriate for maintenance periods when you are monitoring stability rather than actively optimizing. This cadence reduces noise while still catching any significant shifts.
Interpreting delta values
| Delta range | Interpretation | Recommended action |
|---|---|---|
| > +0.10 | Major improvement | Document what you changed -- this is working |
| +0.01 to +0.10 | Moderate improvement | Continue current strategy, monitor next run |
| -0.01 to +0.01 | No significant change | Assess whether recent actions need more time to take effect |
| -0.10 to -0.01 | Moderate decline | Investigate recent content or technical changes |
| < -0.10 | Major decline | Urgent review -- check for crawler blocks, content removal, or competitor displacement |
Correlating with actions
For the most value from the progress summary, use it in combination with the Action Correlation feature. Log every optimization step you take so you can connect metric changes to specific actions.
What the progress summary cannot tell you
The progress summary measures aggregate visibility change but does not explain why a change occurred. To understand the drivers behind a delta:
- Check Prompt Movements to see which specific queries changed.
- Check Provider Comparison to see if the change is concentrated on one AI provider.
- Check Competitor Trends to see if competitor activity is a factor.
The progress summary is your starting point. The other trend sub-pages provide the diagnostic depth.
Common questions about the progress summary
Why do my metrics fluctuate even though I changed nothing?
AI responses are probabilistic. The same prompt submitted to the same provider can produce different answers on different days. Temperature settings, model updates, and backend infrastructure changes all introduce variability. The 0.01 threshold is designed to absorb this noise, but you may still see small movements in the underlying numbers. This is expected behavior, not a data quality issue.
How soon after a content change should I expect to see improvements?
This depends on the provider type. For RAG-based providers like Perplexity, changes can appear within days to weeks because they search the web in real time. For generative models like Claude, OpenAI, and Gemini, changes require a training data update, which can take weeks to months. Run at least two or three analyses after a content change before concluding that it had no effect.
What if my delta is large but my sample size is small?
Treat large deltas with small sample sizes skeptically. If you only have 8 valid responses, a single response changing can shift your rate by over 12 percentage points. Wait for a run with a larger sample size before acting on the data. The sample size warning badge is there specifically to prevent premature conclusions from statistically unreliable data.