

Action Correlation
Action Correlation
The action correlation feature connects the optimization steps you take with the visibility changes you observe. By logging your actions and seeing them as markers on the trend chart, you can establish cause-and-effect relationships between what you did and what changed in your AI visibility metrics.
Actions tab integration
The trends page works together with the Actions tab in your project. The actions tab is where you log the optimization steps you have taken -- content changes, technical fixes, SEO work, or any other activity that might influence your AI visibility.
How actions flow into trends
- You log an action on the actions tab with a date, category, and description.
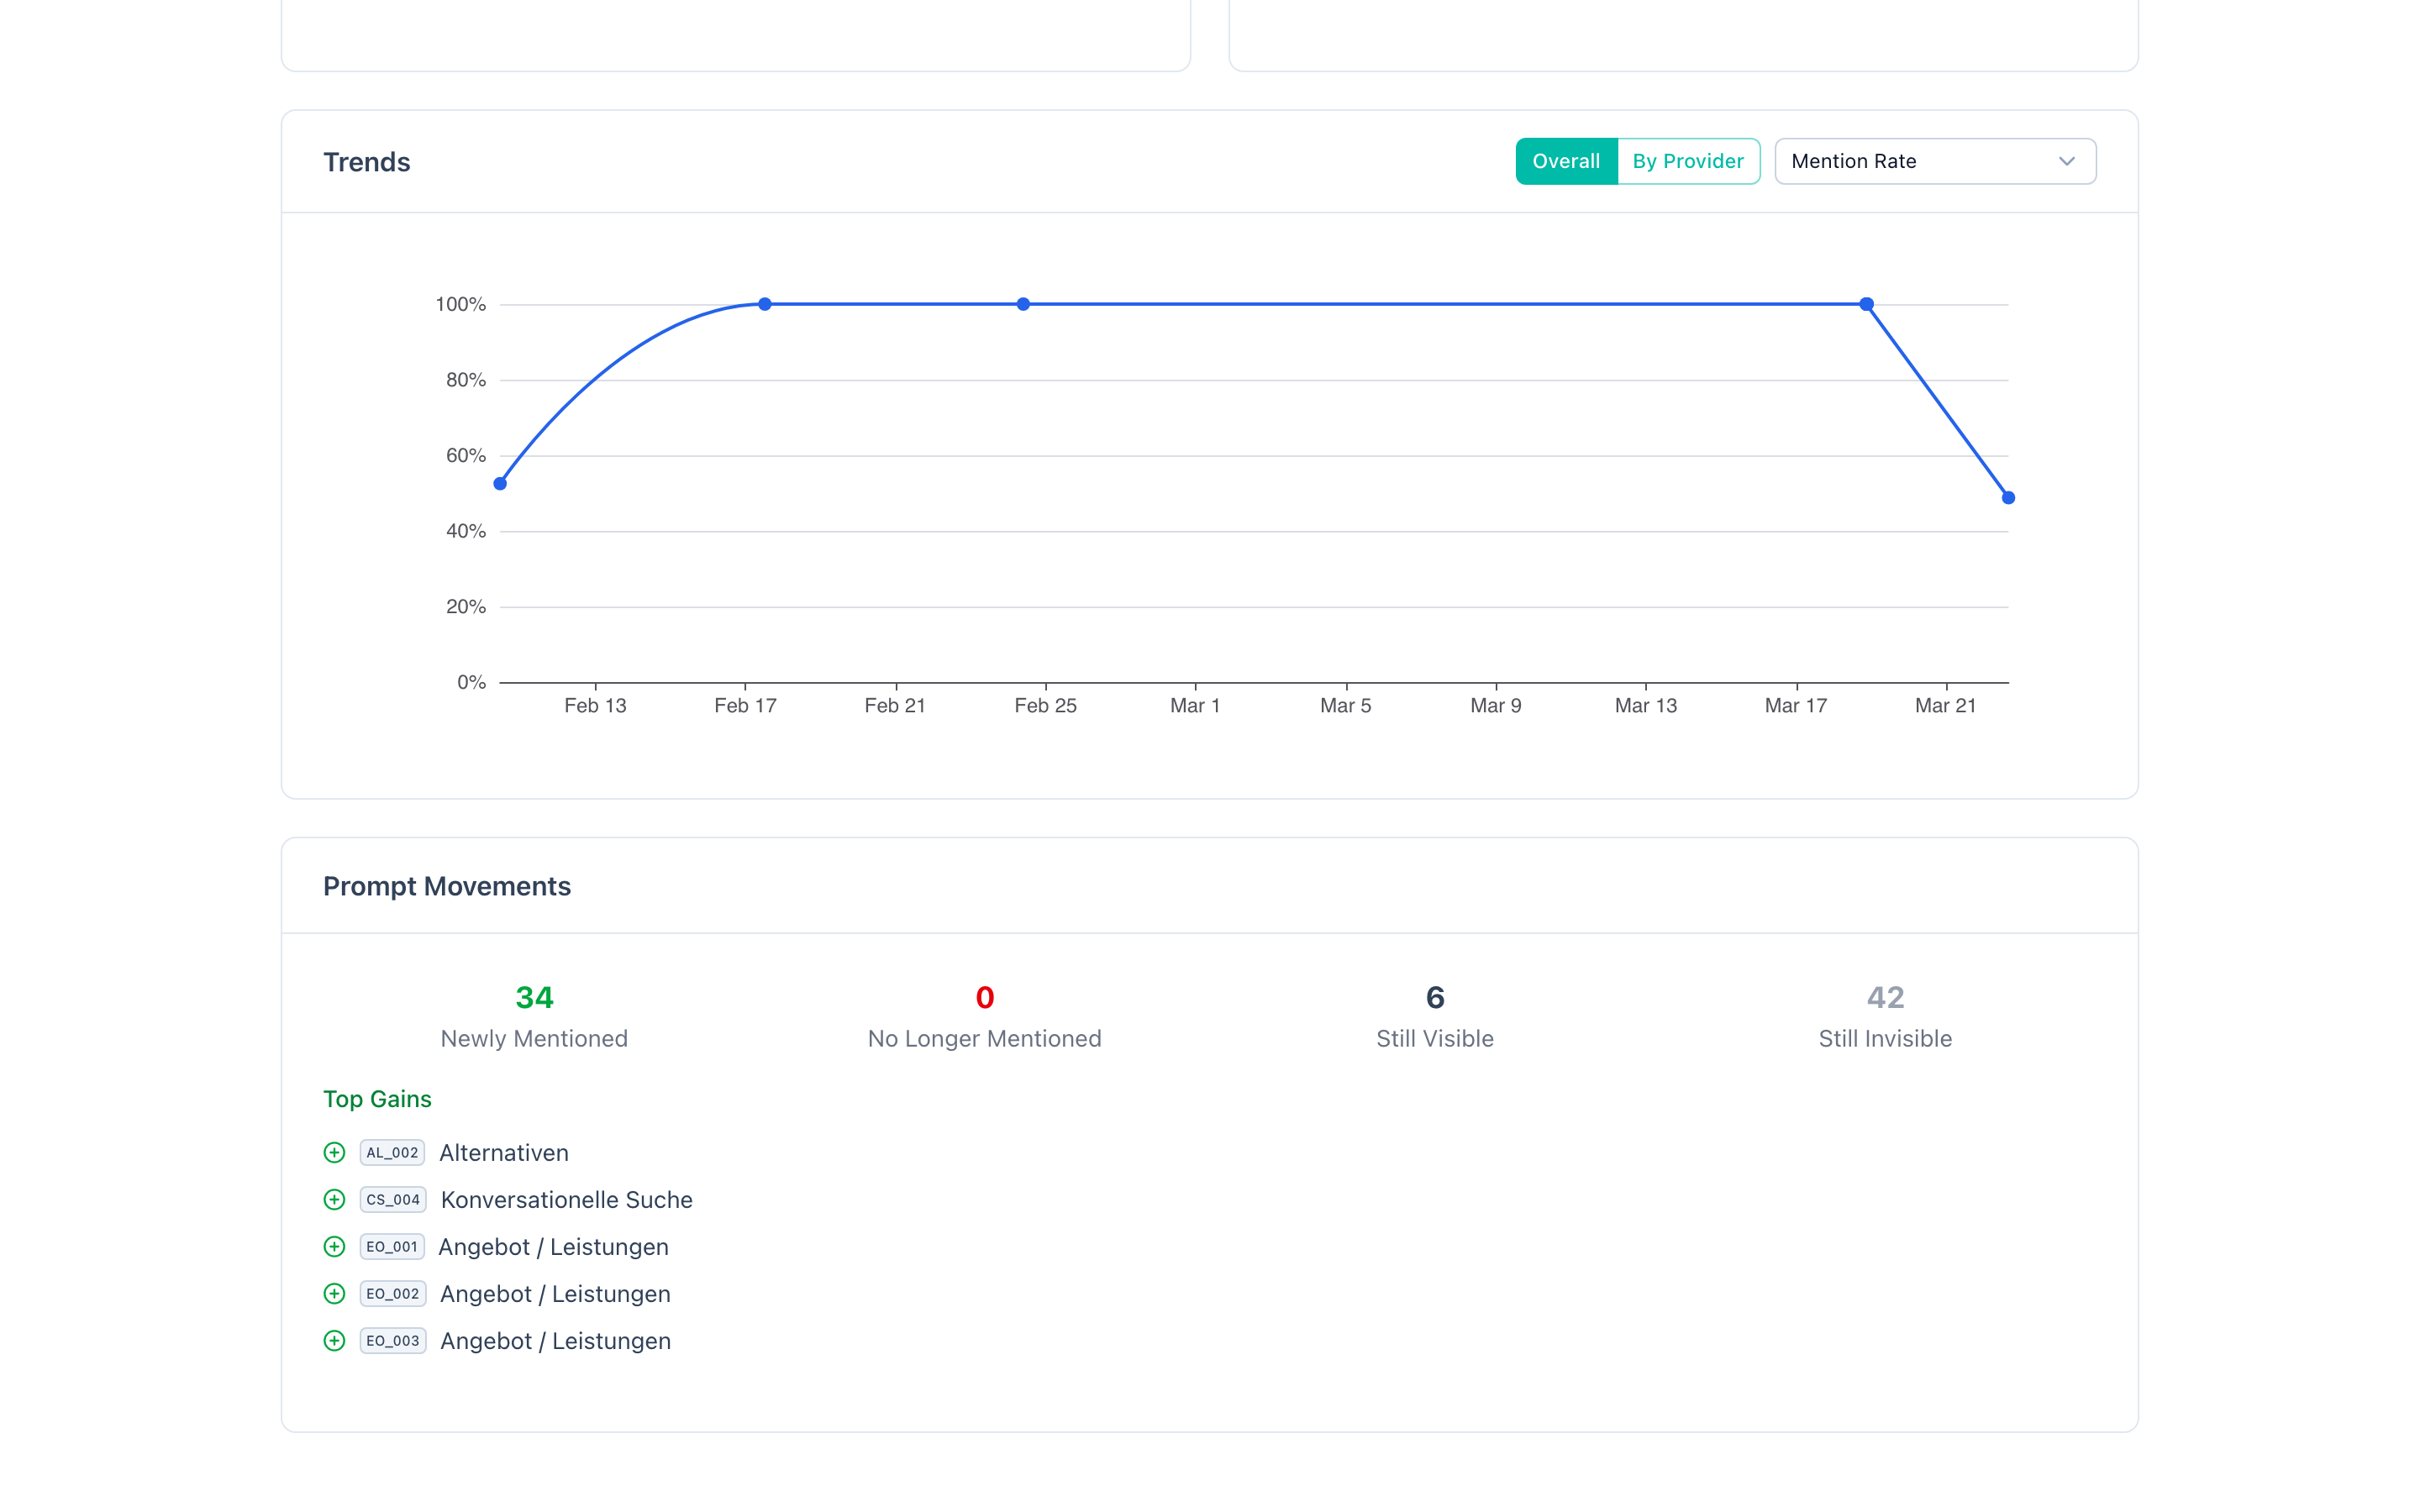
- The action appears as a marker on the trends chart timeline at the date you specified.
- When you view the trend chart, you can visually correlate action markers with metric changes in subsequent runs.
This simple workflow creates a powerful audit trail of your optimization efforts.
Action markers on trend charts
Action markers appear as vertical indicators on the trend chart timeline. They are positioned at the date you logged the action, allowing you to see where your optimization efforts fall relative to metric data points.
Reading the chart with markers
When you see a metric increase following an action marker, this suggests a positive correlation. For example:
- You log "Published comprehensive FAQ page for product X" on March 1.
- The run completed on March 15 shows a 5 percentage point increase in entity mention rate.
- The gained prompts include queries related to product X.
This sequence provides strong evidence that the FAQ page contributed to the improvement.
Multiple markers between runs
If multiple actions are logged between two runs, it becomes harder to attribute the change to a single action. This is normal in active optimization periods. The markers still help you narrow down the contributing factors, even if perfect attribution is not possible.
Markers with no visible impact
Not every action produces a visible metric change. This is important information too:
- For generative models (Claude, OpenAI, Gemini), actions that affect your website content may not show results until the model's next training data update, which can be months away.
- For RAG models (Perplexity), content changes should be reflected more quickly, typically within days to weeks.
- Some actions create compounding effects that only become visible after multiple related improvements.
A marker with no immediate impact does not mean the action was wasted. It means you need more data points to assess its effect.
Categories of actions
When logging actions on the actions tab, you can categorize them to make the correlation analysis more meaningful. Common action categories include:
Content creation
New content published on your website:
- New landing pages targeting specific keywords.
- Blog posts or articles on topics aligned with your prompts.
- FAQ pages answering questions that match your analysis prompts.
- Case studies, whitepapers, or guides that establish topical authority.
Content optimization
Improvements to existing content:
- Rewriting page titles and meta descriptions for better entity association.
- Restructuring content with clearer headings and answer-ready paragraphs.
- Adding or improving FAQ sections on existing pages.
- Updating outdated information to improve content freshness.
Schema markup
Structured data changes:
- Adding Organization schema to your homepage.
- Implementing FAQPage schema on FAQ content.
- Adding HowTo schema to instructional content.
- Implementing Product, Review, or other relevant schema types.
Technical changes
Infrastructure and accessibility changes:
- Updating robots.txt to allow AI crawlers (GPTBot, ClaudeBot, Google-Extended, PerplexityBot).
- Creating or updating your llms.txt file.
- Implementing or fixing HTTPS.
- Updating your sitemap.xml with new or modified pages.
- Improving page load speed and Core Web Vitals.
SEO work
Search engine optimization activities:
- Backlink acquisition campaigns.
- Internal linking improvements.
- Keyword targeting adjustments.
- Domain authority building activities.
External activities
Actions outside your website:
- Press releases or media coverage.
- Directory listings and business profiles.
- Industry publication contributions.
- Social media campaigns that might influence AI training data.
Establishing cause and effect
Action correlation helps you move from speculation to evidence-based GEO optimization. Here is a framework for establishing causal relationships:
The correlation checklist
Before concluding that an action caused a metric change, verify:
- Timing -- did the metric change occur after the action, not before? This seems obvious but is worth confirming.
- Relevance -- does the action relate to the topics where metrics changed? If you published a page about "cloud security" and the gained prompts are about "cloud security," the connection is strong.
- Provider alignment -- does the metric change appear on the provider(s) you would expect? A content change should affect Perplexity quickly (RAG) but may take longer for Claude (training data).
- No confounding factors -- did anything else change at the same time? Competitor activity, seasonal trends, or provider model updates can all influence metrics.
- Reproducibility -- have you seen similar actions produce similar results before? A single correlation could be coincidence, but a pattern is evidence.
Building a GEO playbook
Over time, action correlation data helps you build a personalized GEO playbook -- a documented set of actions that reliably produce positive results for your specific brand and industry.
Example playbook entries:
| Action type | Typical impact | Time to effect | Confidence |
|---|---|---|---|
| FAQ page creation | +3-5 pp entity mention rate | 1-2 weeks (Perplexity), 2-6 months (generative) | High |
| Organization schema | +1-2 pp entity mention rate | 2-4 weeks | Medium |
| Robots.txt update | +2-8 pp across all metrics | 1-4 weeks | High |
| Backlink campaign | +1-3 pp website citation rate | 4-12 weeks | Medium |
Your specific numbers will differ, but the framework applies universally.
Common pitfalls in correlation analysis
Attributing delayed effects to recent actions
If you made a change 6 months ago and see improvement now, it might be the older action finally taking effect (e.g., a generative model incorporated your content in its latest training update). Do not automatically attribute it to your most recent action.
Ignoring negative correlations
If metrics declined after an action, investigate whether the action itself caused harm. For example, restructuring a website could temporarily break internal links or remove content that AI systems previously referenced.
Confirmation bias
It is natural to look for evidence that your actions worked. Be equally attentive to actions that produced no change -- these are just as valuable for understanding what does and does not influence AI visibility.
The importance of tracking what you did
Without action logging, trend data is descriptive but not prescriptive. You can see that your metrics improved, but you cannot confidently explain why or replicate the improvement.
Building institutional knowledge
If multiple team members work on GEO optimization, action logs create a shared record of what was tried. New team members can review the action history alongside trend data to understand what strategies have worked.
Justifying investment
When you need to report on GEO ROI, action correlation provides concrete evidence. Instead of saying "our AI visibility improved," you can say "after implementing FAQ schema on 15 pages (logged March 1), our entity mention rate increased by 7 percentage points across the next three runs."
Avoiding repeated mistakes
Actions that produced negative results are valuable data points. Without a log, teams risk repeating the same ineffective or harmful changes. With action correlation, you have a record of what to avoid.
Practical workflow
A recommended workflow for using action correlation effectively:
Before optimization
- Complete a baseline run to establish current metrics.
- Review the Progress Summary and Prompt Movements to identify priority areas.
- Plan your optimization actions based on the Diagnosis recommendations.
During optimization
- Implement changes on your website, content, or technical infrastructure.
- Log each action on the actions tab immediately, while details are fresh. Include the date, category, and a specific description of what you did and why.
After optimization
- Wait for the next run to complete (or trigger a manual run if using scheduled runs).
- Check the trend chart for action markers aligned with metric changes.
- Review Prompt Movements to see which specific queries were affected.
- Check Provider Comparison to see which providers reflected the change.
- Document your findings and update your GEO playbook.
Ongoing
- Repeat the cycle with new actions based on what you learned.
- Review your action history periodically to identify patterns and refine your strategy.
This systematic approach transforms GEO from a trial-and-error process into a data-driven discipline.